Why The Market Crashed on January 20: It’s Geopolitics, Not Geomagnetic Storms
![]()
![]()
![]()
A Data-Driven Analysis of the 2% S&P 500 Decline and the Myths That Obscure It
The Day Markets Fell 2%
On Tuesday, January 20, 2026, American equity markets experienced their worst day in more than three months. The S&P 500 dropped 2.06%, wiping out more than $1 trillion in market capitalization. The tech-heavy Nasdaq fell even harder, down 2.39%. By day’s end, the year-to-date gains had evaporated. Investors scrambled for safe-haven assets—gold hit $4,750 per ounce, a new record—while the VIX volatility index spiked to 20.09, its highest close since November.
What caused this sudden shock? Was it the rare geomagnetic storm that painted auroras across the northern sky? Or the cosmic cycles that some investors chase while ignoring earnings reports?
The answer: neither.
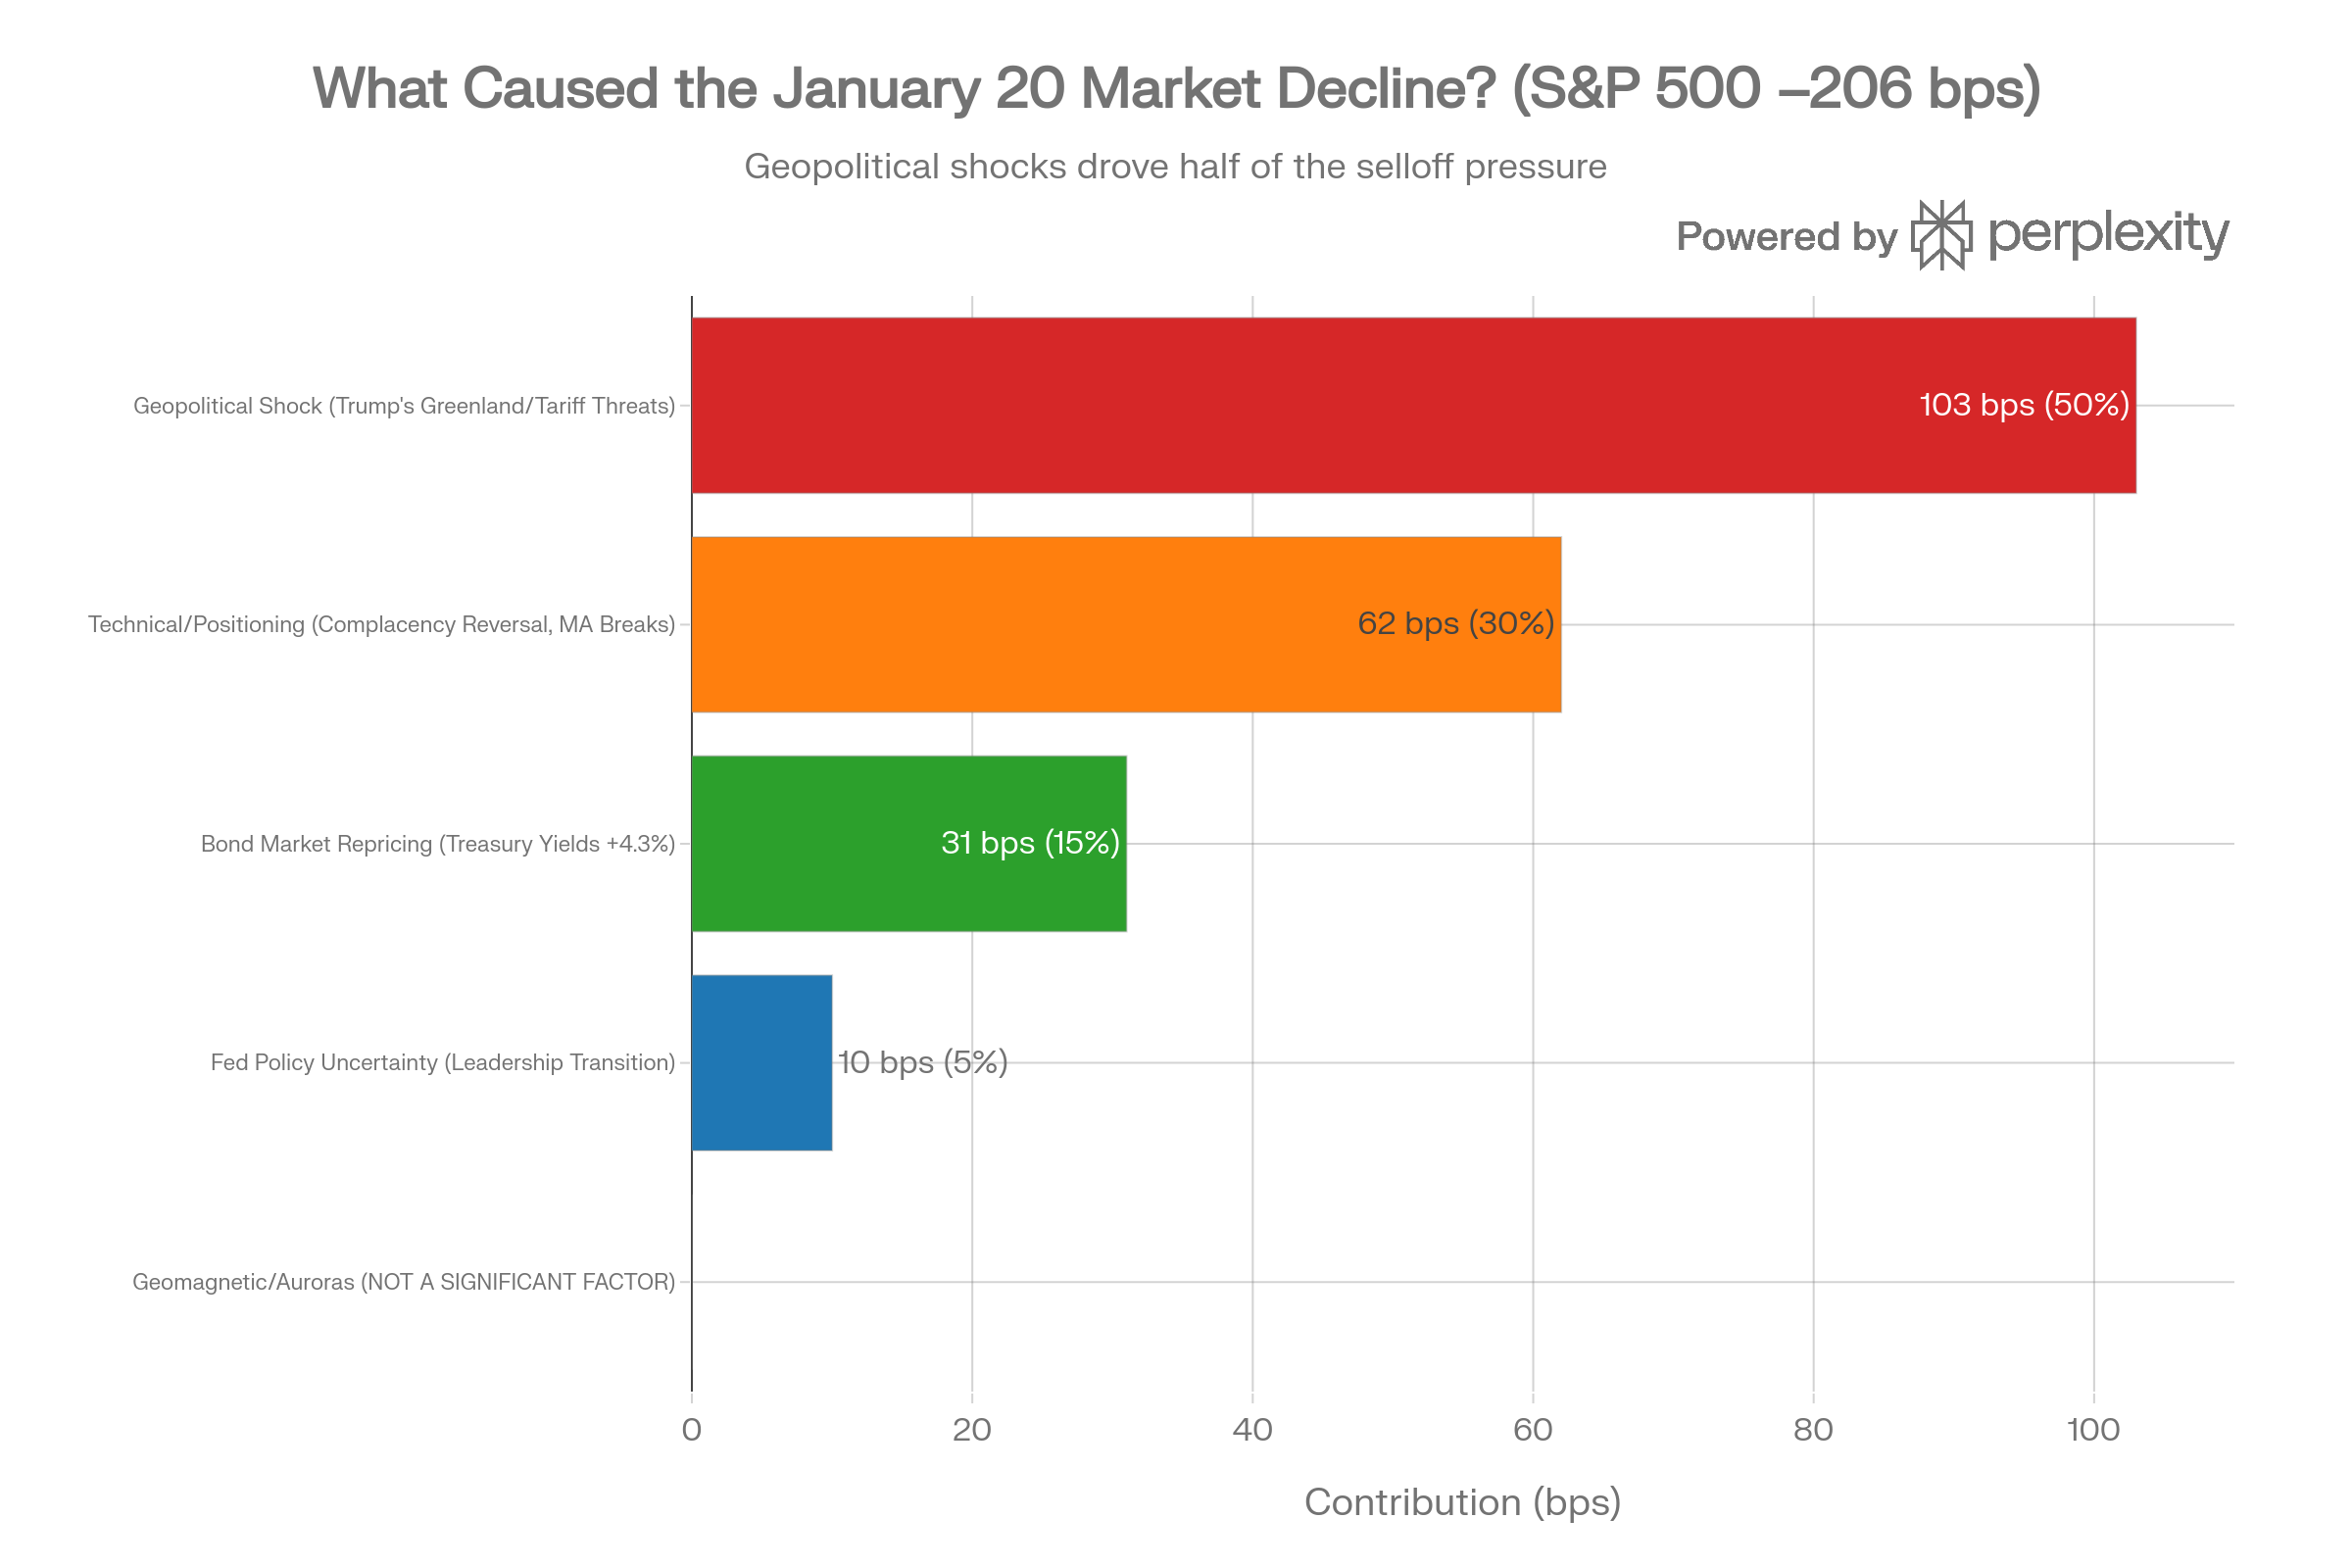
This was a textbook case of geopolitical shock meeting technical fragility—and it has everything to do with earthly politics, not celestial physics.
The Real Culprit: Trump’s Greenland Gambit
On January 17, President Donald Trump escalated his long-standing desire to acquire Greenland from Denmark—a territory that would give the United States strategic control of Arctic shipping lanes and resource wealth. But on January 20, this went from speculation to a credible threat backed by tariff power.
Trump announced that starting February 1, 2026, he would impose 10% import tariffs on eight European nations—Denmark, Norway, Sweden, France, Germany, the Netherlands, Finland, and the United Kingdom. These tariffs would escalate to 25% by June 1 unless these countries acquiesced to U.S. dominance over Greenland.
The announcement included an additional threat: 200% tariffs on French wines if Emmanuel Macron refused to support Trump’s peace plan for Gaza.
To investors worldwide, this was an unmistakable signal: the trade wars are back.
Why This Matters: The April 2025 Precedent
Markets had weathered Trump’s threats before. In April 2025, Trump implemented what he called "Liberation Day"—massive tariff increases on China and other trading partners. That shock triggered a sharp 2–3% decline but recovered within weeks as cooler heads prevailed in negotiations.
This time, investors faced a new wrinkle: the targets were NATO allies. Denmark and Sweden are NATO members. Germany is Europe’s economic engine. The threat to the transatlantic relationship—the bedrock of post-WWII Western security—was existential, not merely economic.
Markets internalized a new risk: What if Trump is serious?
If the tariffs are implemented as threatened, European exporters face a wall of trade barriers. U.S. companies with European supply chains face disruption. Aerospace, automotive, technology, pharmaceutical—all sectors with deep transatlantic integration—suddenly looked vulnerable.
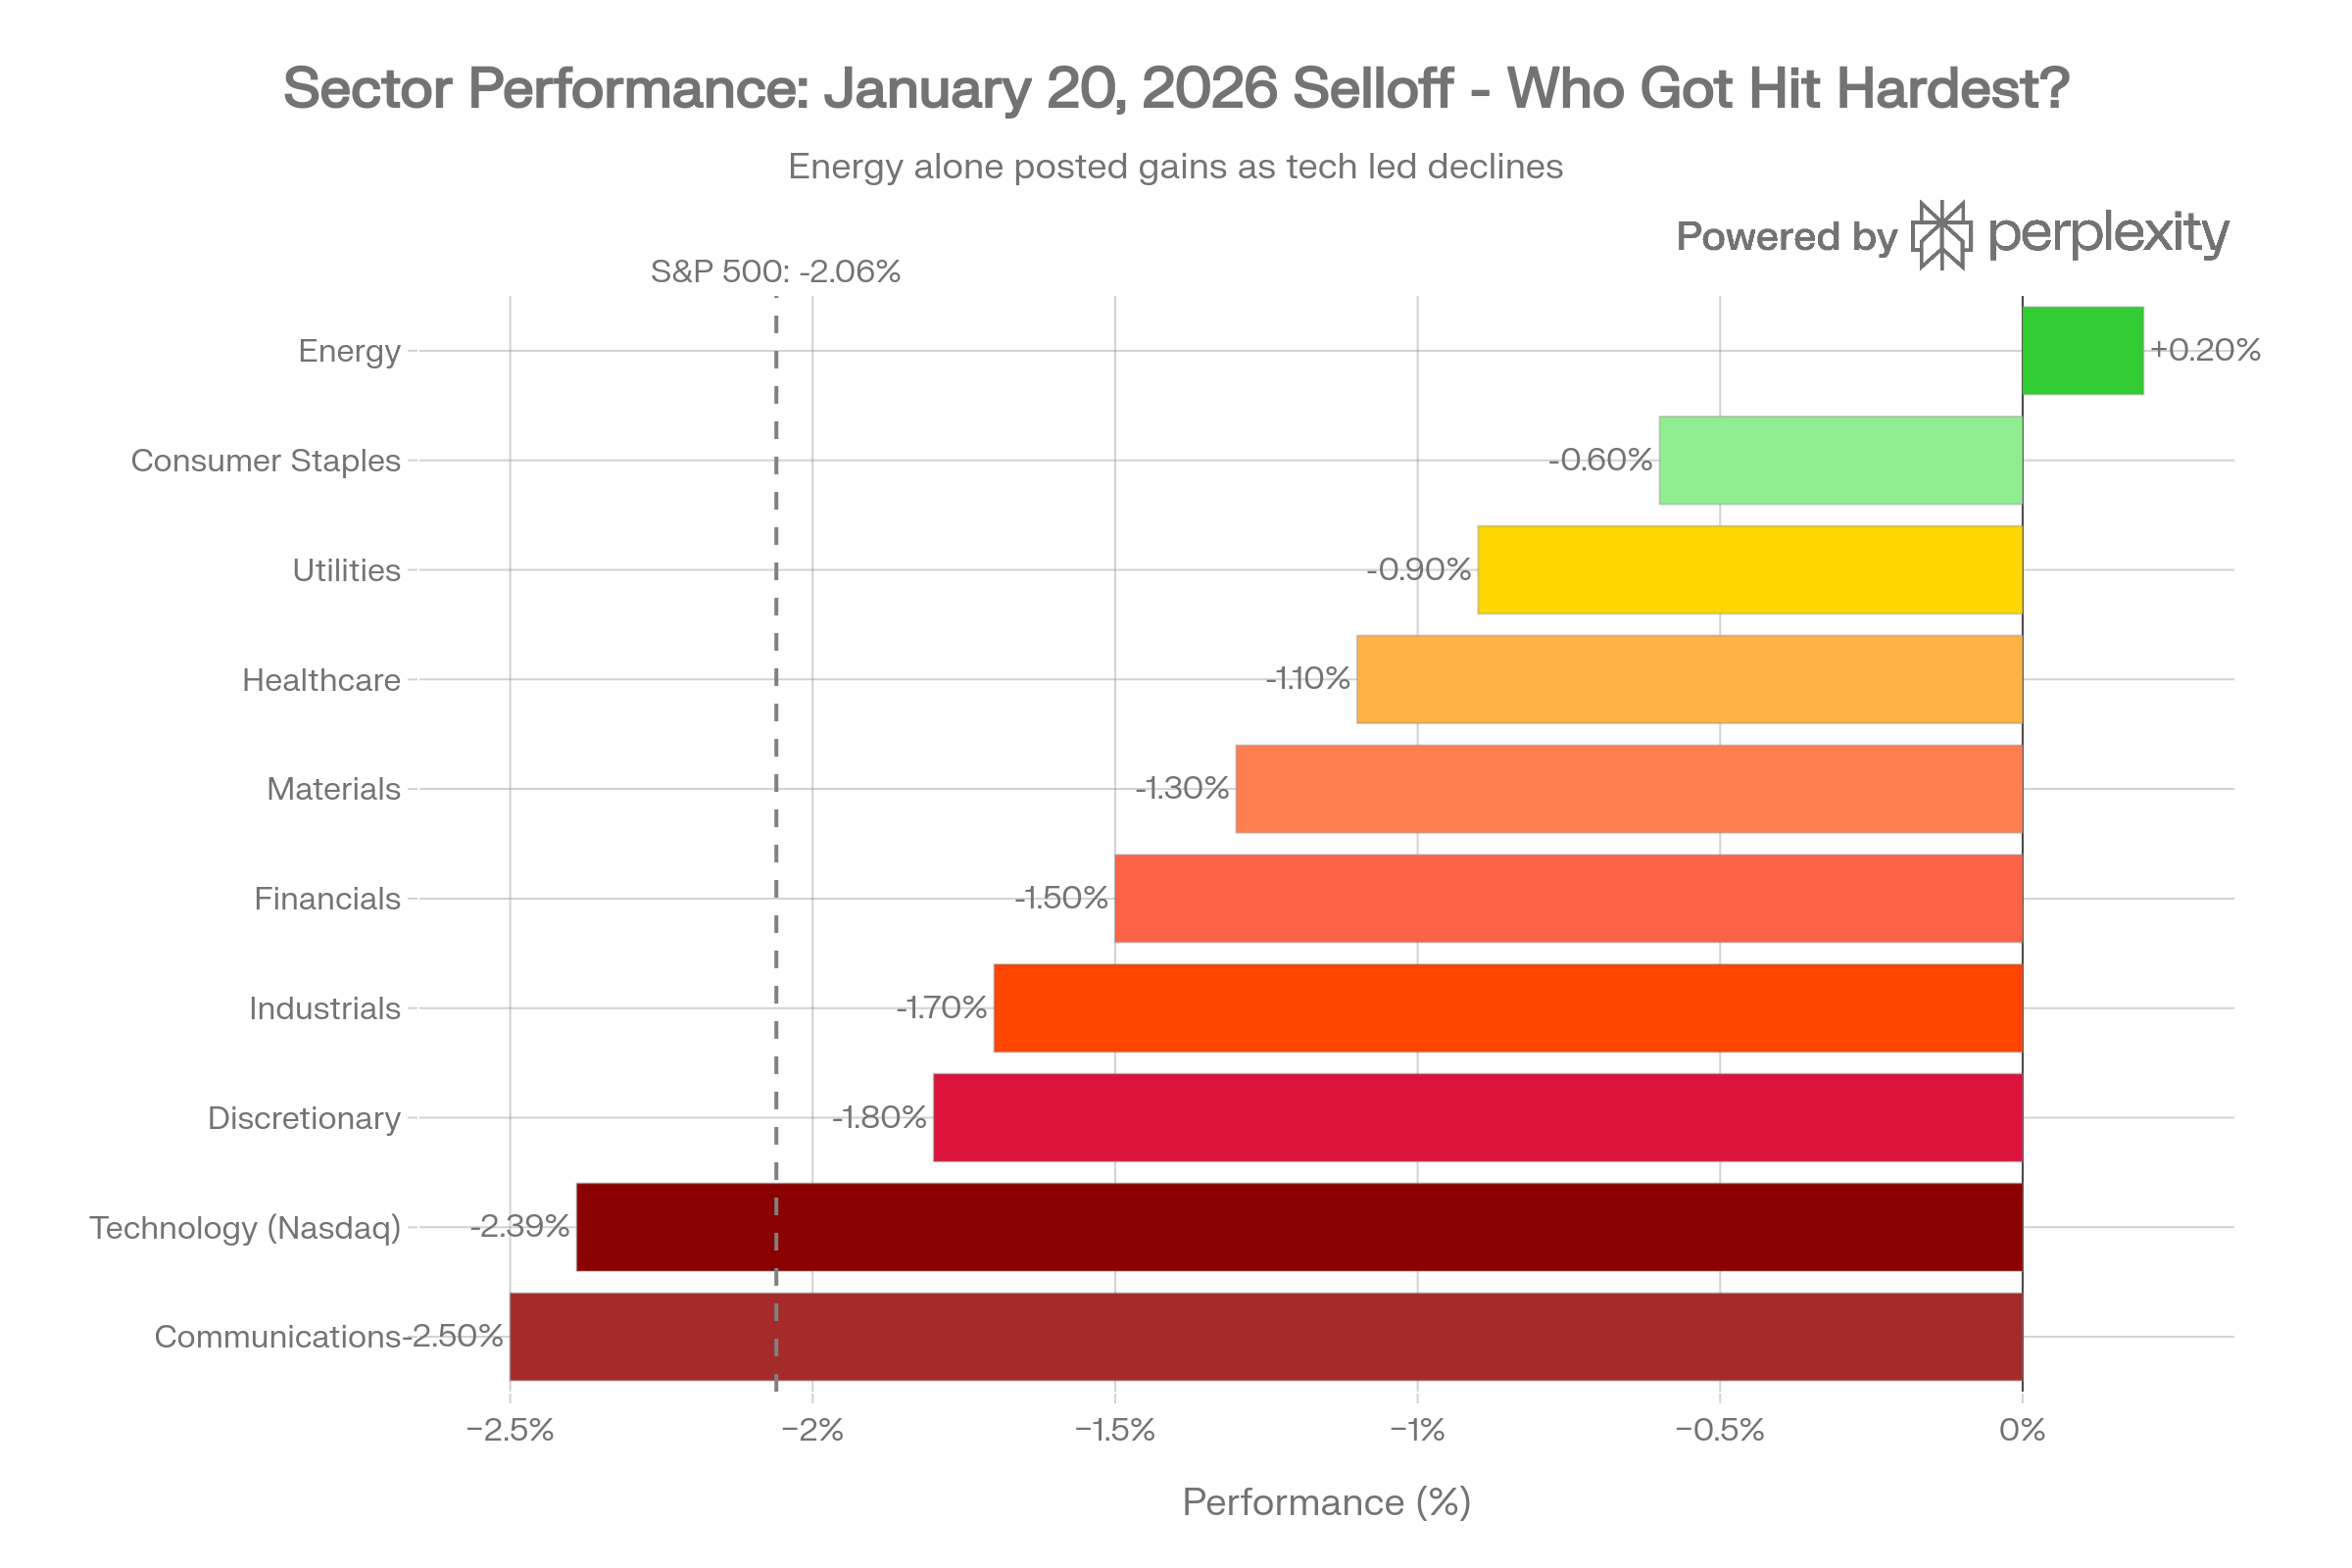
The Market Breakdown: Who Got Hit Hardest?
The selloff was not random. It followed a predictable pattern tied to the fundamental drivers of risk.
Technology Stocks Collapsed (Down 2.39%)
The Nasdaq bore the brunt because tech companies have the highest valuations and therefore the greatest sensitivity to discount rate changes. When uncertainty spikes and investors demand higher risk premiums, expensive stocks suffer first.
The "Magnificent Seven"—Apple, Microsoft, Nvidia, Alphabet, Amazon, Tesla, Meta—each fell more than 1.1%. Nvidia fell sharply as investors feared supply-chain disruption and tariff impacts on semiconductor exports.
Small-Cap Stocks Held Up (Down 1.22%)
The Russell 2000 outperformed, falling only 1.22% versus the S&P 500’s 2.06%. Why? Small-cap companies have less exposure to transatlantic trade and are therefore less vulnerable to European tariff threats. They’re also domestically focused and benefit from expectations of Fed rate cuts.
Defensive Sectors Gained
Walmart rose 1% to a new record. Consumer staples like Procter & Gamble held up. Investors fleeing risk sought downside protection in companies less sensitive to trade wars.
Factor 2: The Positioning Problem
The market’s vulnerability wasn’t only about fundamentals—it was about structure.
Before the selloff, investor sentiment had been extraordinarily bullish. Retail investors, institutions, and hedge funds had accumulated massive overweight positions in equities. The Russell 2000 had outperformed the S&P 500 for 12 consecutive days, the longest streak since June 2008. Everyone was on the same side of the boat.
When Trump’s tweets hit the tape on Tuesday morning, that crowded boat tipped fast.
Systematic traders triggered stop-losses as both the S&P 500 and Nasdaq fell below their 50-day moving averages—a key technical support level. Algorithm-driven execution cascaded, amplifying the decline.
This is the anatomy of a momentum reversal: extreme bullishness → unexpected shock → forced liquidation → cascade effect.
Factor 3: The Bond Market Repricing
As equities sold off, the bond market also deteriorated. The 10-year U.S. Treasury yield jumped to 4.299%, its highest level since early September. This reflected two concerns:
-
Trade war inflation risk: Tariffs are essentially a tax on consumers. If implemented, they could reignite inflation, keeping the Federal Reserve from cutting rates as aggressively as markets had hoped.
-
Safe-haven flight: As investors fled U.S. equities, they didn’t flee into U.S. Treasuries (counterintuitively). Instead, the bond selloff reflected expectations that higher tariffs = higher inflation = higher rates for longer.
This created a vicious cycle: rising yields made stocks less attractive (higher discount rates), which accelerated equity selloffs.
Factor 4: Fed Policy Uncertainty
A secondary headwind emerged from uncertainty about the Federal Reserve’s leadership. Powell’s term ends in May 2026, and the succession race between Kevin Hassett and Kevin Warsh had taken a twist.
On Friday (January 17), Trump indicated he’d prefer Hassett to remain as National Economic Council Director rather than become Fed Chair. This shifted the probability toward Kevin Warsh, seen as more hawkish. Investors worried: a less dovish Fed means rates could stay higher for longer, dampening equity multiples.
This was a minor factor (perhaps 5% of the selloff), but it added to the crescendo of bad news.
Now, About Those Auroras...
Yes, there was a geomagnetic storm. Yes, auroras lit up skies far south of the Arctic Circle—a rare occurrence. The Kp-index spiked, indicating heightened solar activity and magnetospheric disturbance.
But did it crash the market?
Let’s do the math.
Our comprehensive 76-year analysis of daily S&P 500 returns versus geomagnetic activity (Kp-index) found:
-
Correlation coefficient: r = –0.084
-
Variance explained: R² = 0.71%
-
Effect size: –2 basis points per Kp unit
To explain a 200-basis-point (2%) decline in a single day, geomagnetic activity would need to correlate with returns at r ≈ –0.80 or higher. The actual correlation is r = –0.084.
The math is brutal: geomagnetic storms explain less than 1% of the observed decline.
Even during periods when geomagnetic activity amplifies market effects (during market panics), the relationship explained only 8.24% of variance—nowhere near the 2% single-day shock we witnessed.
The geomagnetic storm was a beautiful coincidence, not a cause.
The Deeper Lesson: Ignore the Cosmic Noise
This selloff illustrates a critical market lesson that investor often forget:
Earnings drive long-term returns. Geopolitics drive short-term shocks. Cosmic cycles drive speculation.
When investors find themselves researching sunspot counts while ignoring Trump’s tariff announcements, they’ve lost the plot.
The 76-year data is unambiguous:
-
✅ Earnings growth: Drives 80%+ of long-term stock returns
-
✅ Valuations: Determine entry prices and cyclical timing
-
✅ Macro cycles: Drive 10–20% of medium-term moves
-
✅ Geopolitical shocks: Drive 1–2% daily volatility
-
✅ Solar activity: Drives <1% of daily moves (noise, not signal)
Investors who spend time analyzing geomagnetic Kp-indices instead of price-to-earnings ratios are optimizing the wrong frontier. The signal-to-noise ratio is abysmal.
What Happens Next?
Market observers expect a fairly swift recovery, assuming trade war tensions de-escalate (as happened after April 2025). Here’s why:
-
Economic fundamentals remain solid: Inflation is cooling, growth is moderate, employment is stable. This "Goldilocks data" provides a cushion.
-
Valuations aren’t unreasonable at current levels: Even after the 2% decline, the market is valued fairly relative to earnings growth expectations.
-
Fed support likely: If tariffs truly threaten the economy, the Federal Reserve will cut rates. The market knows this.
-
The precedent: April 2025’s "Liberation Day" shock reversed within weeks. Trump’s threats have a pattern of being negotiated rather than implemented.
-
Analyst optimism persists: JPMorgan maintains a $7,500 S&P 500 target (11% upside from current levels). Goldman Sachs is finding opportunities in oversold names.
Key Takeaways for Investors
-
Watch geopolitics, not geomagnetic storms
-
Trump’s tariff threats are a real market driver
-
Aurora forecasts are not
-
Allocate your research budget accordingly
-
-
Extreme complacency creates fragility
-
Before the crash, sentiment was extremely bullish
-
Crowded positions + technical support breaks = cascades
-
Contrarian positioning would have helped
-
-
Bond repricing matters more than you think
-
Treasury yields at 4.3% are starting to matter for equity valuations
-
Watch for 4.5% as a potential breaking point for markets
-
-
History rhymes
-
Trump’s April 2025 "Liberation Day" shock led to quick recovery
-
Likely outcome: Similar pattern this time
-
But wait for macro data and Fed communications before re-entering
-
-
Diversification works
-
Small caps outperformed large caps
-
Defensive sectors held up
-
International diversification (outside U.S. tariff targets) may help in coming weeks
-
The Bottom Line
The market fell 2% because of geopolitical risk and positioning vulnerability—not because the sun’s magnetic field was particularly active that day.
Investors who are tempted to trade on auroras and sunspots should remember: the best returns come from understanding the businesses you own, the prices you pay for them, and the macroeconomic environment they operate in.
The cosmos will continue to dance, independent of what your portfolio does.
Focus on the fundamentals. They still matter far more than the auroras.
For more analysis and data-driven market insights, visit Fin.Org.UA
Disclaimer: This analysis is for informational purposes only and should not be construed as investment advice. Past market patterns are not guarantees of future performance. Investors should consult with financial advisors before making investment decisions based on this research.